



Run the Bronx 2026 at Bronx Community College, University Heights, Saturday, May 2, 2026 V1 Video by Síle Moloney
Run the Bronx, the annual race comprising a 5K run, 10K run and 2-mile walk, was held once again this year on Saturday, May 2, at Bronx Community College in University Heights, where a host of shiny trophies and medals were awarded to pumped up runners in the presence of Bronx Borough President Vanessa Gibson. A kid’s fun run was also held.
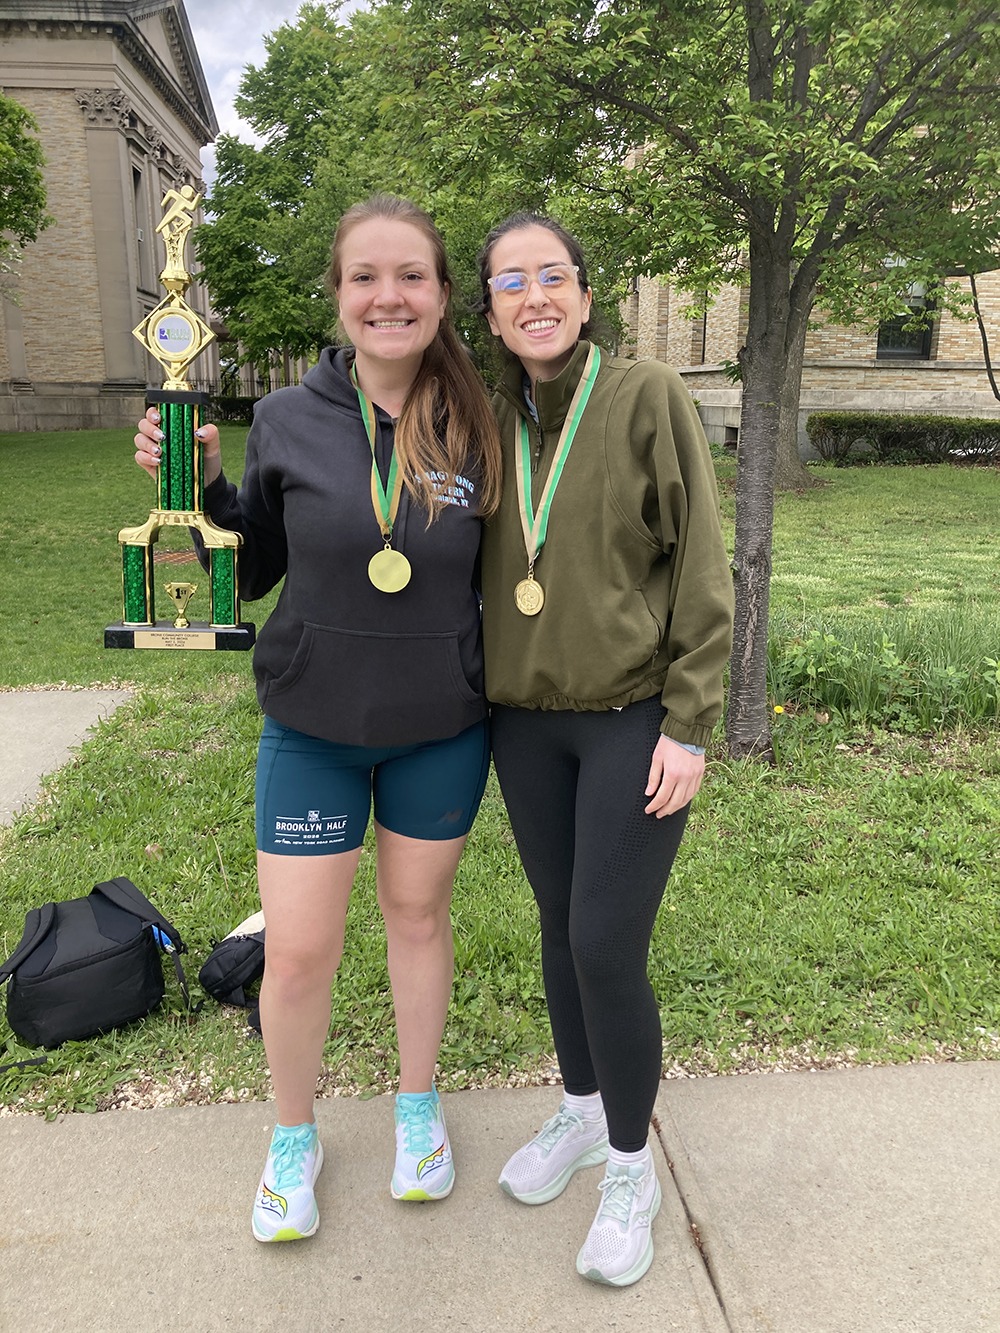
Photo by Síle Moloney
As reported, The Bronx has ranked 62 out of New York State’s 62 counties every year for several years now when it comes to health rankings according to the Robert Wood Johnson Foundation’s county health ranking report. The Run the Bronx event was born out of a need to address the disparity.
Run the Bronx 2026 at Bronx Community College, University Heights, Saturday, May 2, 2026 V2 Video by Síle Moloney
Norwood News spoke to some of the runners on the day to get their reaction. First-place trophy winner in her age group, Ariella Trotsanko, was absolutely jubilant as she accepted her trophy, alongside her friend, Cira Cardaci, who also ran on the day.
Asked if she was surprised that she won in her category, Trotsanko, who has been running since 2022, said, “I was! I won second place in my age group last year. This year, I’m in a different age group. I work for the CUNY Office of Central Research so it’s great to be part of the CUNY running community and to be representing all the campuses, and to help spur [on] this great community.”

Photo by Síle Moloney
Trotsanko continued, “Bronx is a very special place, and this race means a lot in terms of spurring health and wellness for the local community, so I’m so happy to be a part of it.”
Asked what the best thing was about running (apart from the wins!) laughing, she said, “To be part of an amazing community; I’m part of a run club in my local neighborhood and it’s just so much fun to get out there everyday and chat with people, to be taking care of myself, and just pound the pavement every day, to get better for myself.”
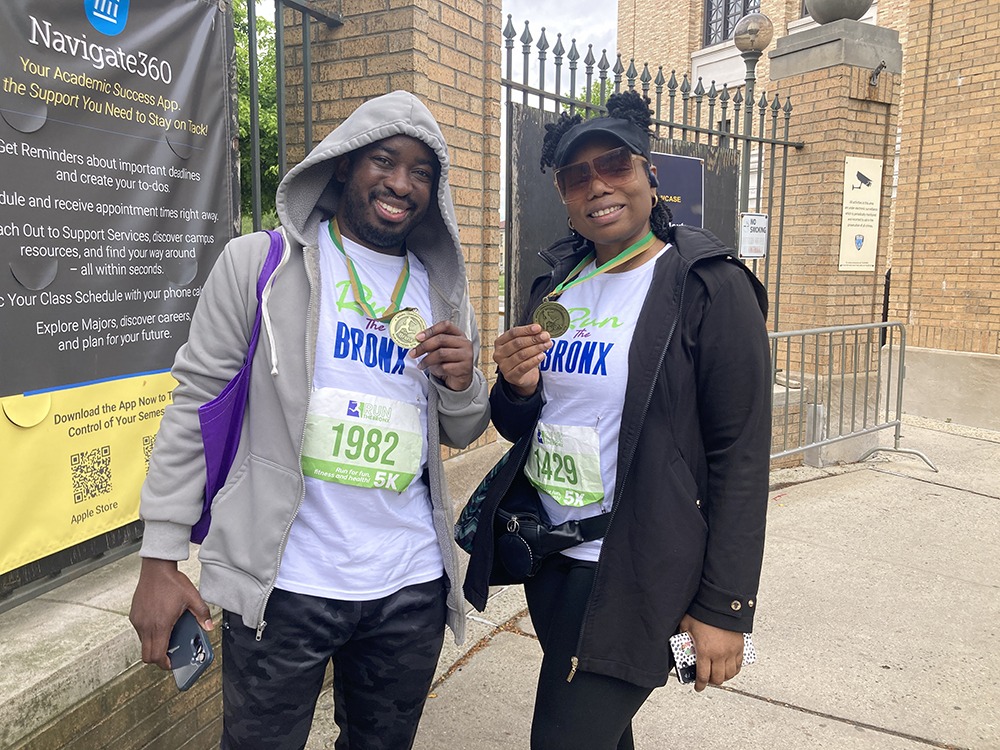
Photo by Síle Moloney
Asked if she had any words of advice for those who might be considering running for the first time, she said, “Just take it slow. Go easy. Get yourself into a sport that you like, and running is so accessible; all you need is a pair of sneakers!”
Run the Bronx 2026 at Bronx Community College, University Heights, Saturday, May 2, 2026 V4 Video by Síle Moloney
We also spoke to Aylin Villada, 28, and asked her how the race went for her. “It was really good!” she said. “It was really nice seeing everybody come out and support, people outside with water bottles, people outside of their houses. We were looking at everyone, so it felt really nice to be supported in that way. There were a lot of hills so it was really hard. I did the 5K and it was really good!”

Photo by Síle Moloney
Asked if she was a regular runner, Villada said, “No… a little bit, yeah! I try to run once or twice a week, but max is like 3 to 4 miles.” Asked if she participated in a lot of races, she said, “I don’t! This is my only one! I participated in it last year. I ran it with my friend who’s a teacher in The Bronx so I come and support her and her school.”
Run the Bronx 2026 at Bronx Community College, University Heights, Saturday, May 2, 2026 V5 Video by Síle Moloney
Asked what prompted her to take up running, Villada said, “When I was growing up, my dad took me and my sister out running to the park and he was always very adamant that we were always doing some sort of sport, whether it be running, swimming so I kind of grew up doing sports.”
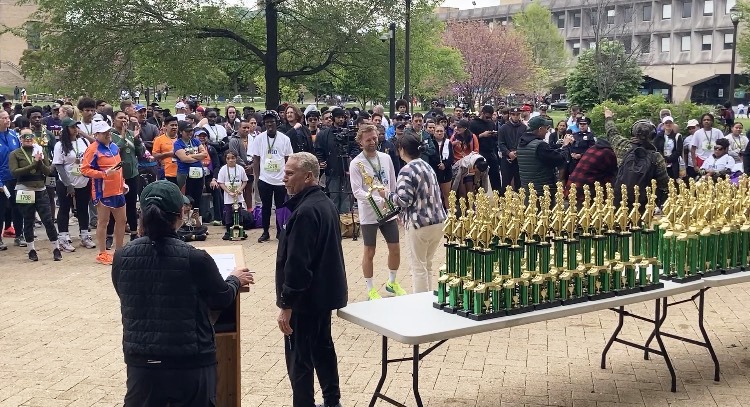
Photo by Síle Moloney
Asked what the best thing about running was, she said, “I guess now that I’m older, just pushing myself mentally and seeing how far I can go.”
Run the Bronx 2026 at Bronx Community College, University Heights, Saturday, May 2, 2026 V6 Video by Síle Moloney
Asked if she had any words of encouragement for those who might be considering taking it up, she said, “I would say it gets easier. Just try and push yourself a little bit. Don’t give yourself too many expectations. If it’s for the first time, just be happy that you’ve even stepped outside and even attempted to run…or walk. You don’t have to start off running. You can just walk.”
Abdel Khalil was the first man to win the 5K in a time of 16 minutes, 51 seconds, while Ari Gibbs was the first woman to cross the line in the 5K in a time of 20 minutes, 19 seconds.
Run the Bronx 2026 at Bronx Community College, University Heights, Saturday, May 2, 2026 V7 Video by Síle Moloney
In the 10K race, Abelino Aletorre was the first man to cross the finish line in a time of 33 minutes, 5 seconds, while Tiasha Roberts-Liverpool was the first woman to finish the race in a time of 38 minutes, 26 seconds.
Check out Norwood News’ YouTube channel for more clips of the day in addition to those linked here.
Click here and here to read our previous coverage of the New York City marathon.
Run the Bronx 2026 at Bronx Community College, University Heights, Saturday, May 2, 2026 V8 Video by Síle Moloney
Local running group Bronx Nomads meet at the entrance to the Williamsbridge Oval park in Norwood each Monday evening around 6 p.m. for group running sessions catering to all levels in a supportive environment. Follow the group on Instagram at @BronxNomads.You can also check out @BoogieDownBronxRunners on Instagram.
Some of the latest available Bronx County health indicators according to New York State Department of Health, broken down by race and ethnicity are outlined in the following graphs.
| Bronx County Health Indicators by Race and Ethnicity, 2021-2023 | ||||||
| Health Indicator | Non-Hispanic | Hispanic | Total | |||
| White | Black | Asian/Pacific | American Indian | |||
| Islander | or Alaska Native | |||||
| Socio-Demographic Indicators | ||||||
| Population (2024) | 122,886 | 410,192 | 64,648 | 4,201 | 767,477 | 1,384,724 |
| Percentage of population (2024) | 8.90% | 29.60% | 4.70% | 0.30% | 55.40% | 100.00% |
| Percentage of population aged 65 years or older (2023) | 28.20% | 15.70% | 15.40% | 15.10% | 12.90% | 15.20% |
| Median annual household income in US dollars (2020-2024)~ | 78,005 | 50,010 | 74,012 | 47,392 | 41,962 | 48,676 |
| Percentage of families below poverty (2020-2024)~ | 8.70% | 20.90% | 14.60% | 27.90% | 26.50% | 22.50% |
| Percentage of children under age 18 below poverty (2020-2024)~ | 20.00% | 34.60% | 23.80% | 37.00% | 39.50% | 35.90% |
| Percentage unemployed among the civilian labor force (2020-2024)~ | 8.00% | 12.00% | 6.20% | 8.60% | 12.00% | 11.40% |
| Percentage of population with no health insurance (2020-2024)~ | 3.40% | 6.20% | 5.00% | 12.70% | 8.30% | 7.10% |
| Percentage of population aged 25 years or older with a bachelor’s degree or higher (2020-2024)~ | 41.90% | 23.70% | 38.40% | 15.80% | 16.10% | 22.40% |
| Percentage of population in single parent families (2020-2024)~ | 9.20% | 36.10% | 9.00% | 36.60% | 36.10% | 32.00% |
| Percentage of population with a disability (2020-2024)~ | 19.20% | 17.10% | 12.20% | 16.60% | 18.30% | 17.70% |
| Percentage of population who speak English less than very well (2020-2024)~ | 10.80% | 9.80% | 42.30% | 33.10% | 37.70% | 14.70% |
| Percentage of high school students who dropped out (2023-2024) | 5.00% | 9.70% | 2.80% | 10.50% | 11.90% | 10.30% |
| Arrests per 1,000 population aged 18 years or older (2022-2024) | 13.4 | 62.2 | 12.8 | 25.5 | 35.9 | 40.6 |
Source: New York State Department of Health
Bronx County Health Indicators by Race and Ethnicity, 2021-2023
| Health Indicator | Non-Hispanic | Hispanic | Total | |||
| White | Black | Asian/Pacific | American Indian | |||
| Islander | or Alaska Native | |||||
| General Health Indicators | ||||||
| Total mortality per 100,000 population, age-adjusted | 717.6 | 773.6 | 259.9 | 69.2* | 644.5 | 714.5 |
| Percentage of deaths that are premature (< 75 years) | 36.90% | 64.80% | 46.80% | 75.0%* | 58.10% | 56.70% |
| Years of potential life lost per 100,000 population, age-adjusted | 7,883.80 | 10,559.60 | 1,872.60 | 2,232.80 | 7,411.90 | 8,610.70 |
| Potentially preventable hospitalizations among adults, age-adjusted rate per 10,000 (2022-2024) | 79.6 | 163.8 | 52.8 | 69.4 | 155.7 | 175.8 |
Source: New York State Department of Health
Bronx County Health Indicators by Race and Ethnicity, 2021-2023
| Health Indicator | Non-Hispanic | Hispanic | Total | |||
| White | Black | Asian/Pacific | American Indian | |||
| Islander | or Alaska Native | |||||
| Birth-Related Indicators | ||||||
| Number of births per year (3 year average) | 932 | 4,277 | 875 | 7 | 9,658 | 16,536 |
| Percentage of births with early (1st trimester) prenatal care | 70.30% | 54.50% | 64.00% | s | 58.90% | 58.20% |
| Percentage of births with adequate prenatal care (APNCU)^ | 69.90% | 59.30% | 70.90% | s | 63.00% | 62.40% |
| Percentage of premature births (< 37 weeks gestation – clinical estimate) | 9.10% | 13.90% | 10.40% | s | 10.40% | 11.20% |
| Percentage of low birthweight births (< 2.5 kg) | 8.80% | 14.50% | 13.30% | s | 9.10% | 10.80% |
| Teen pregnancies per 1,000 females aged under 18 years | 1.5 | 5.8 | 1.7 | NA | 6.2 | 6.3 |
| Pregnancies per 1,000 females aged 15-44 years | 61.7 | 91.8 | 78.9 | NA | 89.7 | 96.3 |
| Fertility per 1,000 females aged 15-44 years | 45.8 | 49.1 | 65.2 | 7.3 | 56.8 | 56.1 |
| Infant mortality per 1,000 live births | 5 | 7.5 | 1.5* | s | 2.9 | 5.1 |
| Percentage of low-risk births delivered by cesarean section | 31.10% | 34.50% | 32.10% | s | 30.00% | 31.40%
|
Source: New York State Department of Health
Bronx County Health Indicators by Race and Ethnicity, 2021-2023
| Health Indicator | Non-Hispanic | Hispanic | Total | |||
| White | Black | Asian/Pacific | American Indian | |||
| Islander | or Alaska Native | |||||
| Injury-Related Indicators | ||||||
| Motor vehicle-related mortality per 100,000 population, age-adjusted | 5.5 | 4.7 | 2.5* | 0.0* | 5.2 | 5.2 |
| Unintentional injury mortality per 100,000 population, age-adjusted | 86.9 | 78.9 | 8 | 6.9* | 73.8 | 76 |
| Unintentional injury hospitalizations per 10,000 population, age-adjusted (2022-2024) | 71 | 66.7 | 31.8 | 24.2 | 75.9 | 100.3 |
| Fall hospitalizations per 10,000 population, aged 65 years or older (2022-2024) | 212.6 | 119.9 | 98.3 | 65.8 | 157.8 | 211.6 |
| Poisoning hospitalizations per 10,000 population, age-adjusted (2022-2024) | 13.5 | 15.2 | 2.5 | s | 13.8 | 18.1 |
| Suicide mortality per 100,000 population, age-adjusted | 9.7 | 5.5 | 2.9* | 0.0* | 5.5 | 5.9 |
| Overdose deaths involving opioids, and non-fatal opioid related hospital events per 100,000 population | 792.2 | 507.6 | 23.4 | 266.9 | 394 | 508 |
Source: New York State Department of Health
Bronx County Health Indicators by Race and Ethnicity, 2021-2023
| Health Indicator | Non-Hispanic | Hispanic | Total | |||
| White | Black | Asian/Pacific | American Indian | |||
| Islander | or Alaska Native | |||||
| Respiratory Disease Indicators | ||||||
| Asthma hospitalizations per 10,000 population, age-adjusted (2022-2024) | 5.6 | 22.5 | 8.5 | 13.1 | 25.2 | 27.8 |
| Asthma hospitalizations per 10,000 population, aged 0-17 years (2022-2024) | 9.1 | 42.8 | 18.6 | 30.7* | 43.7 | 54 |
| Chronic lower respiratory disease mortality per 100,000 population, age-adjusted | 24.2 | 17.6 | 6 | 0.0* | 16.6 | 18.7 |
| Chronic lower respiratory disease hospitalizations per 10,000 population, age-adjusted (2022-2024) | 16.3 | 36 | 12.1 | 19.7 | 36.5 | 42.1 |
| Percentage of fee-for-service (FFS) Medicare enrollees who had an annual flu vaccination (2023)~~ | 47% | 32% | 43% | 35% | 31% | 37% |
Source: New York State Department of Health
Bronx County Health Indicators by Race and Ethnicity, 2021-2023
| Health Indicator | Non-Hispanic | Hispanic | Total | |||
| White | Black | Asian/Pacific | American Indian | |||
| Islander | or Alaska Native | |||||
| Heart Disease and Stroke Indicators | ||||||
| Diseases of the heart mortality per 100,000 population, age-adjusted | 191.3 | 209.6 | 62.7 | 6.9* | 142.9 | 178.7 |
| Diseases of the heart hospitalizations per 10,000 population, age-adjusted (2022-2024) | 56.5 | 89.3 | 45 | 43.3 | 82.1 | 98.2 |
| Cerebrovascular disease (stroke) mortality per 100,000 population, age-adjusted | 22.1 | 30.3 | 12.2 | 8.7* | 26.9 | 27.9 |
| Cerebrovascular disease (stroke) hospitalizations per 10,000 population, age-adjusted (2022-2024) | 14.1 | 29.4 | 11.7 | 7.4 | 22.1 | 29.6 |
| Coronary heart disease mortality per 100,000 population, age-adjusted | 164 | 175.5 | 53.4 | 6.9* | 118.3 | 149.7 |
| Coronary heart disease hospitalizations per 10,000 population, age-adjusted (2022-2024) | 14.8 | 16.5 | 20.4 | 13.2 | 21.3 | 24.2 |
| Congestive heart failure mortality per 100,000 population, age-adjusted | 8 | 8.7 | 1.9* | 0.0* | 7.4 | 8.2 |
| Potentially preventable heart failure hospitalization rate per 10,000 population aged 18 years or older (2022-2024) | 40.6 | 61.7 | 17.6 | 22.8 | 44.7 | 58.9 |
Source: New York State Department of Health
Bronx County Health Indicators by Race and Ethnicity, 2021-2023
| Health Indicator | Non-Hispanic | Hispanic | Total | |||
| White | Black | Asian/Pacific | American Indian | |||
| Islander | or Alaska Native | |||||
| Diabetes Indicators | ||||||
| Diabetes mortality per 100,000 population, age-adjusted | 15.7 | 24.6 | 8.9 | 0.0* | 21.8 | 22.2 |
| Diabetes (primary diagnosis) hospitalizations per 10,000 population, age-adjusted (2022-2024) | 14.8 | 35.3 | 8.8 | 12.7 | 33.5 | 37.1 |
| Diabetes (any diagnosis) hospitalizations per 10,000 population, age-adjusted (2022-2024) | 170.9 | 336.7 | 186 | 187.9 | 349.2 | 382.3 |
| Potentially preventable diabetes short-term complications hospitalization rate per 10,000 population aged 18 years or older (2022-2024) | 3.9 | 11.9 | 1.5 | 0.0* | 9.8 | 11.9 |
Source: New York State Department of Health
Bronx County Health Indicators by Race and Ethnicity, 2021-2023
| Health Indicator | Non-Hispanic | Hispanic | Total | |||
| White | Black | Asian/Pacific | American Indian | |||
| Islander | or Alaska Native | |||||
| Cancer Indicators | ||||||
| Lung cancer incidence per 100,000 population, age-adjusted (2020-2022) | 53.6 | 43.8 | 34.4 | NA | 30.6 | 38.5 |
| Colorectal cancer mortality per 100,000 population, age-adjusted (2020-2022) | 16.5 | 10.7 | s | NA | 8.3 | 10.3 |
| Colorectal cancer incidence per 100,000 population, age-adjusted (2020-2022) | 42.3 | 36 | 22.1 | NA | 30.4 | 33.8 |
| Female breast cancer mortality per 100,000 female population, age-adjusted (2020-2022) | 16.7 | 20.2 | s | NA | 12.2 | 16 |
| Female late stage breast cancer incidence per 100,000 female population, age-adjusted (2020-2022) | 45.9 | 51.1 | 33.9 | NA | 36.2 | 42.4 |
| Cervix uteri cancer mortality per 100,000 female population, age-adjusted (2020-2022) | s | 3.5 | s | NA | 2 | 2.4 |
| Cervical cancer incidence per 100,000 female population, age-adjusted (2020-2022) | 8.4 | 7.8 | s | NA | 10.3 | 9 |
| Percentage of female fee-for-service (FFS) Medicare enrollees aged 65-74 years who received an annual mammography screening (2023)~~ | 30% | 29% | 22% | 0% | 24% | 28% |
Source: New York State Department of Health
Bronx County Health Indicators by Race and Ethnicity, 2021-2023 Symbol Meanings
| Symbol | Meaning |
| * | The rate or percentage is unstable. See the “Technical Notes” page |
| s | Data are suppressed. The data do not meet the criteria for confidentiality. |
| ~ | White non-Hispanic, Black (including Hispanic), Asian (including Hispanic, excluding Pacific Islanders), American Indian or Alaska Native (including Hispanic), and Hispanic (of any race). |
| ~~ | White non-Hispanic, Black (including Hispanic), Asian / Pacific Islander (including Hispanic), and Hispanic (of any race). |
| NA | Data do not meet the criteria for statistical reliability or data quality, or data not available. |
| ^ | APNCU: Adequacy of Prenatal Care Utilization Index. |
| In 2015, SPARCS transitioned from ICD-9-CM to ICD-10-CM diagnosis codes. These two are not comparable, so ED and hospitalization data for 2016-and-forward should not be compared with earlier data. | |
| The 2018 population estimates are also used to calculate rates for 2019 and 2020. Later years are from the most recent Vintage estimates. |
Source: New York State Department of Health

admin
Welcome to the Norwood News, a bi-weekly community newspaper that primarily serves the northwest Bronx communities of Norwood, Bedford Park, Fordham and University Heights. Through our Breaking Bronx blog, we focus on news and information for those neighborhoods, but aim to cover as much Bronx-related news as possible. Founded in 1988 by Mosholu Preservation Corporation, a not-for-profit affiliate of Montefiore Medical Center, the Norwood News began as a monthly and grew to a bi-weekly in 1994. In September 2003 the paper expanded to cover University Heights and now covers all the neighborhoods of Community District 7. The Norwood News exists to foster communication among citizens and organizations and to be a tool for neighborhood development efforts. The Norwood News runs the Bronx Youth Journalism Heard, a journalism training program for Bronx high school students. As you navigate this website, please let us know if you discover any glitches or if you have any suggestions. We’d love to hear from you. You can send e-mails to norwoodnews@norwoodnews.org or call us anytime (718) 324-4998.