



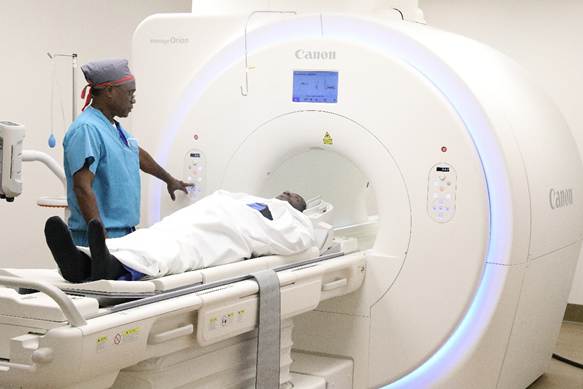
Photo courtesy of NYC Health + Hospitals/North Central Bronx
NYC Health + Hospitals/Jacobi | North Central Bronx unveiled a new $2 million MRI suite on Feb. 18 at its North Central Bronx campus in the Norwood section of The Bronx, complete with renovated rooms and upgraded MRI screening machines.
The new Canon Vantage Orian Encore MRI machines offer faster scan times while delivering clearer, more distinct images, according to hospital officials, who add that the new machines will also boost diagnostic functions and reduce wait time for patients.
They said to improve the patient’s comfort, the system uses a video projection to help relax patients with a calming, virtual experience as well as technology that reduces scanner noise to further improve the patient experience. They said the upgrade is funded with support from the Office of Bronx Borough President Vanessa Gibson.
Alfredo Jones, chief operating officer at NYC Health + Hospitals/NCB, said, “We believe in providing high-quality care to our communities. This new MRI system is part of our commitment to enhancing imaging services at North Central Bronx Hospital. Upgrading our existing MRI unit with new technology allows us to enhance productivity and imaging quality while offering our patients greater comfort and safety to deliver outstanding clinical performance.”
Meanwhile, Dr. Chinyere Anyaogu, deputy chief medical officer at NYC Health + Hospitals/North Central Bronx, said, “The opening of our new MRI suite marks a transformative moment for NCB. This investment is more than just advanced technology; it’s a promise to our community that we will deliver the highest quality of care, right here at home. By expanding access to state-of-the-art diagnostics, we’re not only improving patient outcomes today, but also building a healthier future for generations to come.”
Speaking to Norwood News later, Dr. Bruce Cohen said having an MRI is a very scary environment for a child. “It seems very loud. You hope that some children are able to kind of do it and cooperate with the instructions. Sometimes children have to be sedated in order to go through the exam and also to hold still for the exam.”
He added, “You know, fortunately, we don’t do nearly as many in children as adults, but even for adults it can be a scary experience. There are a lot of people who have difficulty being in a confined space. The noise and the idea of the test bothers people. So you work with everybody and try to make it as comfortable as you can.
Norwood News asked how long, on average, the screening takes. “Different exams take different amounts of time,” Cohen said. “It varies depending on what body parts you’re doing and what specific protocol they use. So, some scans can be quick – in 15 or 20 minutes. Others will be significantly longer.”
Asked if there was anything else he wanted the public to know about the process, Cohen said, “It’s very good for the hospital to have this. Many of the patients that we had to transfer over to Jacobi before to get really high quality scans for certain things, we should be able to do here now.”
Norwood News also spoke with Shad Arkorful from MRI technologies at North Central Bronx and asked what kind of prep was done with patients before they go into the MRI room. “Well, we basically just want to make sure that nobody has any metal within their bodies or on their person,” he said. “So, we actually have barriers. So, MRI has zoning. So there’s levels of zoning where first you get checked in by our nurses, and they’ll screen you.”
Arkorful continued, “Then, when you get changed, we have a scanner that will make sure you have absolutely no metal in your body and you come to us, then we’ll scan you again, and then we’ll ask you about your medical history, just to make sure that you are clear to go into MRI.”
We asked if dental fillings or braces impacted the process. “If you have braces, you should be fine because they’ve actually done a good job of upgrading surgeries into whatever they put into your body in terms of like titanium, like those kind of things, where basically it’s now safe for you to come to MRI,” Arkorful said.
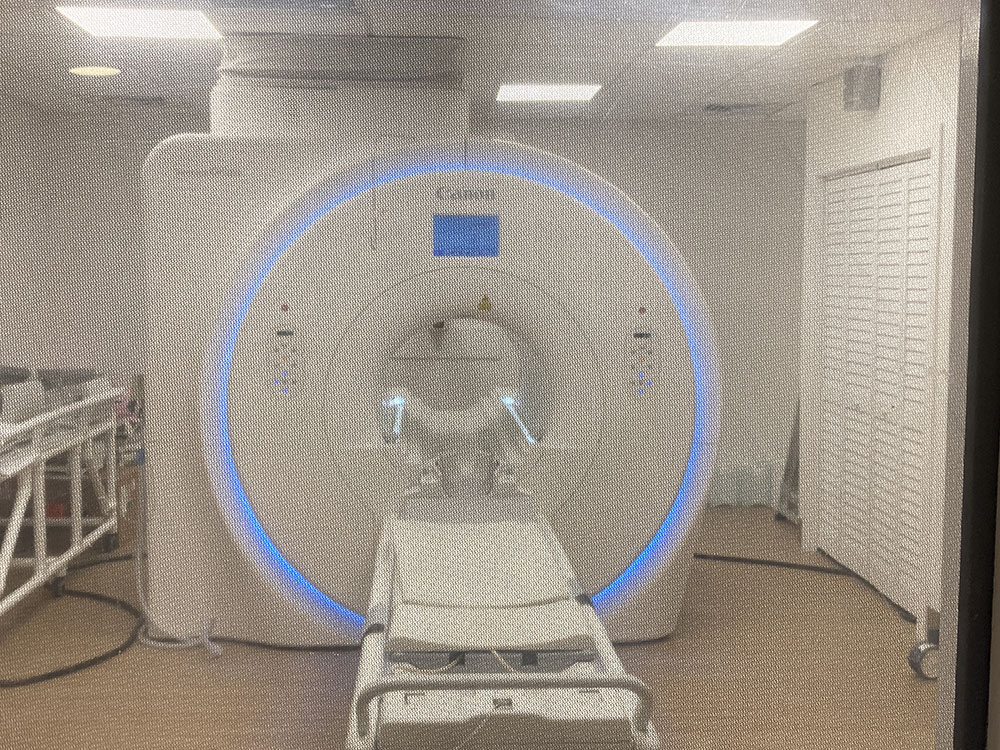
Photo by Síle Moloney
“Before, back then you know, you couldn’t even have pacemakers and things like that, but now they’re making pacemakers that are even able for some MRI scanners so technology is really advancing, and they’re actually like paying attention to the safety concerns that are happening in MRI,” he added.
We talked again about the extra trauma for kids who need to get an MRI and the fear that comes with that. “They’re doing a good job of putting more light and making the boards actually just a little bit bigger without sacrificing the quality of the imaging, itself,” Arkorful said.
Asked if the darkness gave better quality, Arkorful said, “It doesn’t necessarily have to be dark, but you want your board to just be a little bit smaller. Asked how long a patient would typically spend inside the machine, he said, “Well, that completely actually depends on the patient, or depends on what you’re imaging and the patient themselves.”
He added, “Those two things matter the most.” We asked maximum, would could it be. “Well, it depends,” he said. “If you have like let’s say a triple spine that has contrast, they may be in this counter for two or three hours, or if you have just a quick brain that you need for a patient in ICU, that can be maybe like six to ten minutes.”
For more information on NYC Health + Hospitals/Jacobi | North Central Bronx, please contact (718) 519-5000.
For some related coverage of NCB, click here, here, here, and here.
The following are some of the latest available Bronx County health indicators, broken down by race and ethnicity.
| Bronx County Health Indicators by Race and Ethnicity, 2021-2023 | ||||||
| Health Indicator | Non-Hispanic | Hispanic | Total | |||
| White | Black | Asian/Pacific | American Indian | |||
| Islander | or Alaska Native | |||||
| Socio-Demographic Indicators | ||||||
| Population (2024) | 122,886 | 410,192 | 64,648 | 4,201 | 767,477 | 1,384,724 |
| Percentage of population (2024) | 8.90% | 29.60% | 4.70% | 0.30% | 55.40% | 100.00% |
| Percentage of population aged 65 years or older (2023) | 28.20% | 15.70% | 15.40% | 15.10% | 12.90% | 15.20% |
| Median annual household income in US dollars (2020-2024)~ | 78,005 | 50,010 | 74,012 | 47,392 | 41,962 | 48,676 |
| Percentage of families below poverty (2020-2024)~ | 8.70% | 20.90% | 14.60% | 27.90% | 26.50% | 22.50% |
| Percentage of children under age 18 below poverty (2020-2024)~ | 20.00% | 34.60% | 23.80% | 37.00% | 39.50% | 35.90% |
| Percentage unemployed among the civilian labor force (2020-2024)~ | 8.00% | 12.00% | 6.20% | 8.60% | 12.00% | 11.40% |
| Percentage of population with no health insurance (2020-2024)~ | 3.40% | 6.20% | 5.00% | 12.70% | 8.30% | 7.10% |
| Percentage of population aged 25 years or older with a bachelor’s degree or higher (2020-2024)~ | 41.90% | 23.70% | 38.40% | 15.80% | 16.10% | 22.40% |
| Percentage of population in single parent families (2020-2024)~ | 9.20% | 36.10% | 9.00% | 36.60% | 36.10% | 32.00% |
| Percentage of population with a disability (2020-2024)~ | 19.20% | 17.10% | 12.20% | 16.60% | 18.30% | 17.70% |
| Percentage of population who speak English less than very well (2020-2024)~ | 10.80% | 9.80% | 42.30% | 33.10% | 37.70% | 14.70% |
| Percentage of high school students who dropped out (2023-2024) | 5.00% | 9.70% | 2.80% | 10.50% | 11.90% | 10.30% |
| Arrests per 1,000 population aged 18 years or older (2022-2024) | 13.4 | 62.2 | 12.8 | 25.5 | 35.9 | 40.6 |
Source: New York State Department of Health
Bronx County Health Indicators by Race and Ethnicity, 2021-2023
| Health Indicator | Non-Hispanic | Hispanic | Total | |||
| White | Black | Asian/Pacific | American Indian | |||
| Islander | or Alaska Native | |||||
| General Health Indicators | ||||||
| Total mortality per 100,000 population, age-adjusted | 717.6 | 773.6 | 259.9 | 69.2* | 644.5 | 714.5 |
| Percentage of deaths that are premature (< 75 years) | 36.90% | 64.80% | 46.80% | 75.0%* | 58.10% | 56.70% |
| Years of potential life lost per 100,000 population, age-adjusted | 7,883.80 | 10,559.60 | 1,872.60 | 2,232.80 | 7,411.90 | 8,610.70 |
| Potentially preventable hospitalizations among adults, age-adjusted rate per 10,000 (2022-2024) | 79.6 | 163.8 | 52.8 | 69.4 | 155.7 | 175.8 |
Source: New York State Department of Health
Bronx County Health Indicators by Race and Ethnicity, 2021-2023
| Health Indicator | Non-Hispanic | Hispanic | Total | |||
| White | Black | Asian/Pacific | American Indian | |||
| Islander | or Alaska Native | |||||
| Birth-Related Indicators | ||||||
| Number of births per year (3 year average) | 932 | 4,277 | 875 | 7 | 9,658 | 16,536 |
| Percentage of births with early (1st trimester) prenatal care | 70.30% | 54.50% | 64.00% | s | 58.90% | 58.20% |
| Percentage of births with adequate prenatal care (APNCU)^ | 69.90% | 59.30% | 70.90% | s | 63.00% | 62.40% |
| Percentage of premature births (< 37 weeks gestation – clinical estimate) | 9.10% | 13.90% | 10.40% | s | 10.40% | 11.20% |
| Percentage of low birthweight births (< 2.5 kg) | 8.80% | 14.50% | 13.30% | s | 9.10% | 10.80% |
| Teen pregnancies per 1,000 females aged under 18 years | 1.5 | 5.8 | 1.7 | NA | 6.2 | 6.3 |
| Pregnancies per 1,000 females aged 15-44 years | 61.7 | 91.8 | 78.9 | NA | 89.7 | 96.3 |
| Fertility per 1,000 females aged 15-44 years | 45.8 | 49.1 | 65.2 | 7.3 | 56.8 | 56.1 |
| Infant mortality per 1,000 live births | 5 | 7.5 | 1.5* | s | 2.9 | 5.1 |
| Percentage of low-risk births delivered by cesarean section | 31.10% | 34.50% | 32.10% | s | 30.00% | 31.40%
|
Source: New York State Department of Health
Bronx County Health Indicators by Race and Ethnicity, 2021-2023
| Health Indicator | Non-Hispanic | Hispanic | Total | |||
| White | Black | Asian/Pacific | American Indian | |||
| Islander | or Alaska Native | |||||
| Injury-Related Indicators | ||||||
| Motor vehicle-related mortality per 100,000 population, age-adjusted | 5.5 | 4.7 | 2.5* | 0.0* | 5.2 | 5.2 |
| Unintentional injury mortality per 100,000 population, age-adjusted | 86.9 | 78.9 | 8 | 6.9* | 73.8 | 76 |
| Unintentional injury hospitalizations per 10,000 population, age-adjusted (2022-2024) | 71 | 66.7 | 31.8 | 24.2 | 75.9 | 100.3 |
| Fall hospitalizations per 10,000 population, aged 65 years or older (2022-2024) | 212.6 | 119.9 | 98.3 | 65.8 | 157.8 | 211.6 |
| Poisoning hospitalizations per 10,000 population, age-adjusted (2022-2024) | 13.5 | 15.2 | 2.5 | s | 13.8 | 18.1 |
| Suicide mortality per 100,000 population, age-adjusted | 9.7 | 5.5 | 2.9* | 0.0* | 5.5 | 5.9 |
| Overdose deaths involving opioids, and non-fatal opioid related hospital events per 100,000 population | 792.2 | 507.6 | 23.4 | 266.9 | 394 | 508 |
Source: New York State Department of Health
Bronx County Health Indicators by Race and Ethnicity, 2021-2023
| Health Indicator | Non-Hispanic | Hispanic | Total | |||
| White | Black | Asian/Pacific | American Indian | |||
| Islander | or Alaska Native | |||||
| Respiratory Disease Indicators | ||||||
| Asthma hospitalizations per 10,000 population, age-adjusted (2022-2024) | 5.6 | 22.5 | 8.5 | 13.1 | 25.2 | 27.8 |
| Asthma hospitalizations per 10,000 population, aged 0-17 years (2022-2024) | 9.1 | 42.8 | 18.6 | 30.7* | 43.7 | 54 |
| Chronic lower respiratory disease mortality per 100,000 population, age-adjusted | 24.2 | 17.6 | 6 | 0.0* | 16.6 | 18.7 |
| Chronic lower respiratory disease hospitalizations per 10,000 population, age-adjusted (2022-2024) | 16.3 | 36 | 12.1 | 19.7 | 36.5 | 42.1 |
| Percentage of fee-for-service (FFS) Medicare enrollees who had an annual flu vaccination (2023)~~ | 47% | 32% | 43% | 35% | 31% | 37% |
Source: New York State Department of Health
Bronx County Health Indicators by Race and Ethnicity, 2021-2023
| Health Indicator | Non-Hispanic | Hispanic | Total | |||
| White | Black | Asian/Pacific | American Indian | |||
| Islander | or Alaska Native | |||||
| Heart Disease and Stroke Indicators | ||||||
| Diseases of the heart mortality per 100,000 population, age-adjusted | 191.3 | 209.6 | 62.7 | 6.9* | 142.9 | 178.7 |
| Diseases of the heart hospitalizations per 10,000 population, age-adjusted (2022-2024) | 56.5 | 89.3 | 45 | 43.3 | 82.1 | 98.2 |
| Cerebrovascular disease (stroke) mortality per 100,000 population, age-adjusted | 22.1 | 30.3 | 12.2 | 8.7* | 26.9 | 27.9 |
| Cerebrovascular disease (stroke) hospitalizations per 10,000 population, age-adjusted (2022-2024) | 14.1 | 29.4 | 11.7 | 7.4 | 22.1 | 29.6 |
| Coronary heart disease mortality per 100,000 population, age-adjusted | 164 | 175.5 | 53.4 | 6.9* | 118.3 | 149.7 |
| Coronary heart disease hospitalizations per 10,000 population, age-adjusted (2022-2024) | 14.8 | 16.5 | 20.4 | 13.2 | 21.3 | 24.2 |
| Congestive heart failure mortality per 100,000 population, age-adjusted | 8 | 8.7 | 1.9* | 0.0* | 7.4 | 8.2 |
| Potentially preventable heart failure hospitalization rate per 10,000 population aged 18 years or older (2022-2024) | 40.6 | 61.7 | 17.6 | 22.8 | 44.7 | 58.9 |
Source: New York State Department of Health
Bronx County Health Indicators by Race and Ethnicity, 2021-2023
| Health Indicator | Non-Hispanic | Hispanic | Total | |||
| White | Black | Asian/Pacific | American Indian | |||
| Islander | or Alaska Native | |||||
| Diabetes Indicators | ||||||
| Diabetes mortality per 100,000 population, age-adjusted | 15.7 | 24.6 | 8.9 | 0.0* | 21.8 | 22.2 |
| Diabetes (primary diagnosis) hospitalizations per 10,000 population, age-adjusted (2022-2024) | 14.8 | 35.3 | 8.8 | 12.7 | 33.5 | 37.1 |
| Diabetes (any diagnosis) hospitalizations per 10,000 population, age-adjusted (2022-2024) | 170.9 | 336.7 | 186 | 187.9 | 349.2 | 382.3 |
| Potentially preventable diabetes short-term complications hospitalization rate per 10,000 population aged 18 years or older (2022-2024) | 3.9 | 11.9 | 1.5 | 0.0* | 9.8 | 11.9 |
Source: New York State Department of Health
Bronx County Health Indicators by Race and Ethnicity, 2021-2023
| Health Indicator | Non-Hispanic | Hispanic | Total | |||
| White | Black | Asian/Pacific | American Indian | |||
| Islander | or Alaska Native | |||||
| Cancer Indicators | ||||||
| Lung cancer incidence per 100,000 population, age-adjusted (2020-2022) | 53.6 | 43.8 | 34.4 | NA | 30.6 | 38.5 |
| Colorectal cancer mortality per 100,000 population, age-adjusted (2020-2022) | 16.5 | 10.7 | s | NA | 8.3 | 10.3 |
| Colorectal cancer incidence per 100,000 population, age-adjusted (2020-2022) | 42.3 | 36 | 22.1 | NA | 30.4 | 33.8 |
| Female breast cancer mortality per 100,000 female population, age-adjusted (2020-2022) | 16.7 | 20.2 | s | NA | 12.2 | 16 |
| Female late stage breast cancer incidence per 100,000 female population, age-adjusted (2020-2022) | 45.9 | 51.1 | 33.9 | NA | 36.2 | 42.4 |
| Cervix uteri cancer mortality per 100,000 female population, age-adjusted (2020-2022) | s | 3.5 | s | NA | 2 | 2.4 |
| Cervical cancer incidence per 100,000 female population, age-adjusted (2020-2022) | 8.4 | 7.8 | s | NA | 10.3 | 9 |
| Percentage of female fee-for-service (FFS) Medicare enrollees aged 65-74 years who received an annual mammography screening (2023)~~ | 30% | 29% | 22% | 0% | 24% | 28% |
Source: New York State Department of Health
Bronx County Health Indicators by Race and Ethnicity, 2021-2023 Symbol Meanings
| Symbol | Meaning |
| * | The rate or percentage is unstable. See the “Technical Notes” page |
| s | Data are suppressed. The data do not meet the criteria for confidentiality. |
| ~ | White non-Hispanic, Black (including Hispanic), Asian (including Hispanic, excluding Pacific Islanders), American Indian or Alaska Native (including Hispanic), and Hispanic (of any race). |
| ~~ | White non-Hispanic, Black (including Hispanic), Asian / Pacific Islander (including Hispanic), and Hispanic (of any race). |
| NA | Data do not meet the criteria for statistical reliability or data quality, or data not available. |
| ^ | APNCU: Adequacy of Prenatal Care Utilization Index. |
| In 2015, SPARCS transitioned from ICD-9-CM to ICD-10-CM diagnosis codes. These two are not comparable, so ED and hospitalization data for 2016-and-forward should not be compared with earlier data. | |
| The 2018 population estimates are also used to calculate rates for 2019 and 2020. Later years are from the most recent Vintage estimates. |
Source: New York State Department of Health

admin
Welcome to the Norwood News, a bi-weekly community newspaper that primarily serves the northwest Bronx communities of Norwood, Bedford Park, Fordham and University Heights. Through our Breaking Bronx blog, we focus on news and information for those neighborhoods, but aim to cover as much Bronx-related news as possible. Founded in 1988 by Mosholu Preservation Corporation, a not-for-profit affiliate of Montefiore Medical Center, the Norwood News began as a monthly and grew to a bi-weekly in 1994. In September 2003 the paper expanded to cover University Heights and now covers all the neighborhoods of Community District 7. The Norwood News exists to foster communication among citizens and organizations and to be a tool for neighborhood development efforts. The Norwood News runs the Bronx Youth Journalism Heard, a journalism training program for Bronx high school students. As you navigate this website, please let us know if you discover any glitches or if you have any suggestions. We’d love to hear from you. You can send e-mails to norwoodnews@norwoodnews.org or call us anytime (718) 324-4998.