



Photo by Miriam Quiñones
Residents, health professionals, sponsors, and community organizations gathered at the Northeast Bronx YMCA in the Edenwald section of The Bronx on Saturday, June 27, for the 2026 Annual Health Fair. This year’s theme was “Health is Wealth” and the event was described by those involved in its planning as a well-organized celebration of wellness, [poor health] prevention, community and support. Nutritionist and dietitian Gloria Bent of “Bent on Wellness” served as hostess.
Despite the rain, the event was a successful one according to organizers, with attendees enjoying plenty of fun, dancing, and catching up, while also getting educated on healthy living.
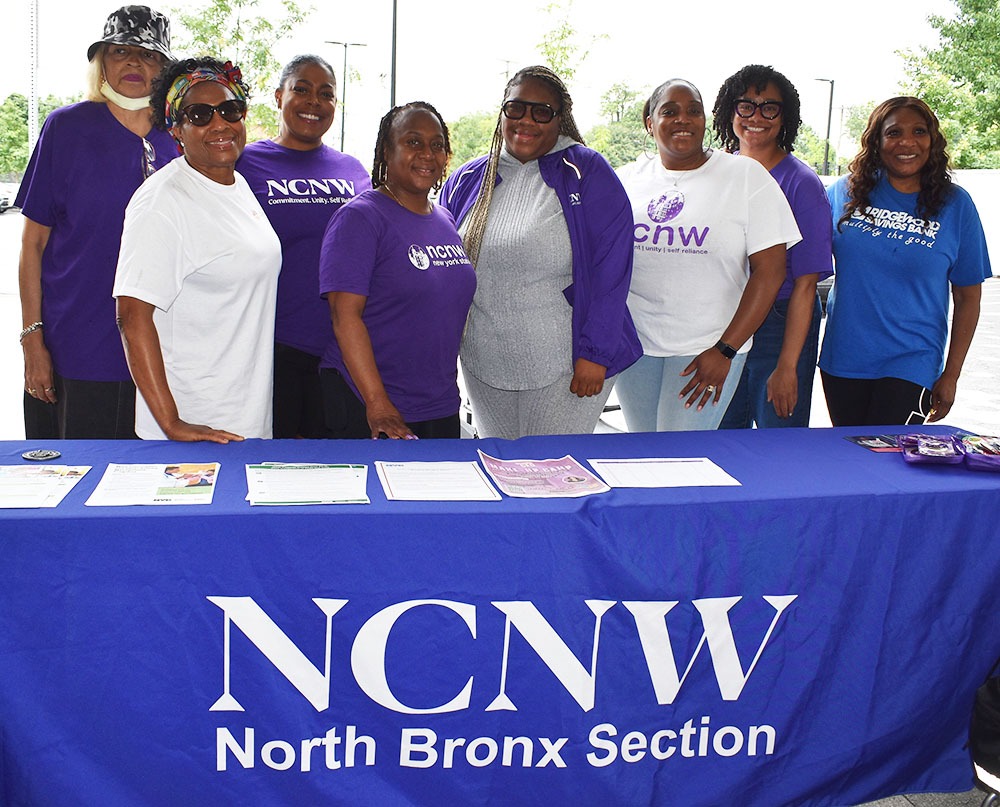
Photo by Miriam Quiñones
Highlights included expert speakers, health screenings, nutrition education, mental health support, guidance for Medicaid families, and resources for children with special needs.
Patricia Kerr, founder and CEO of “I Am a Better Me! Inc.,” and past president of the North Bronx section of the National Council of Negro Women, credited Bent with being “instrumental in bringing together the resources, health professionals, and partners that made the event successful.” Of Bent, Kerr added, “Her leadership helped connect Bronx families with valuable health education, wellness services, and needed support.”
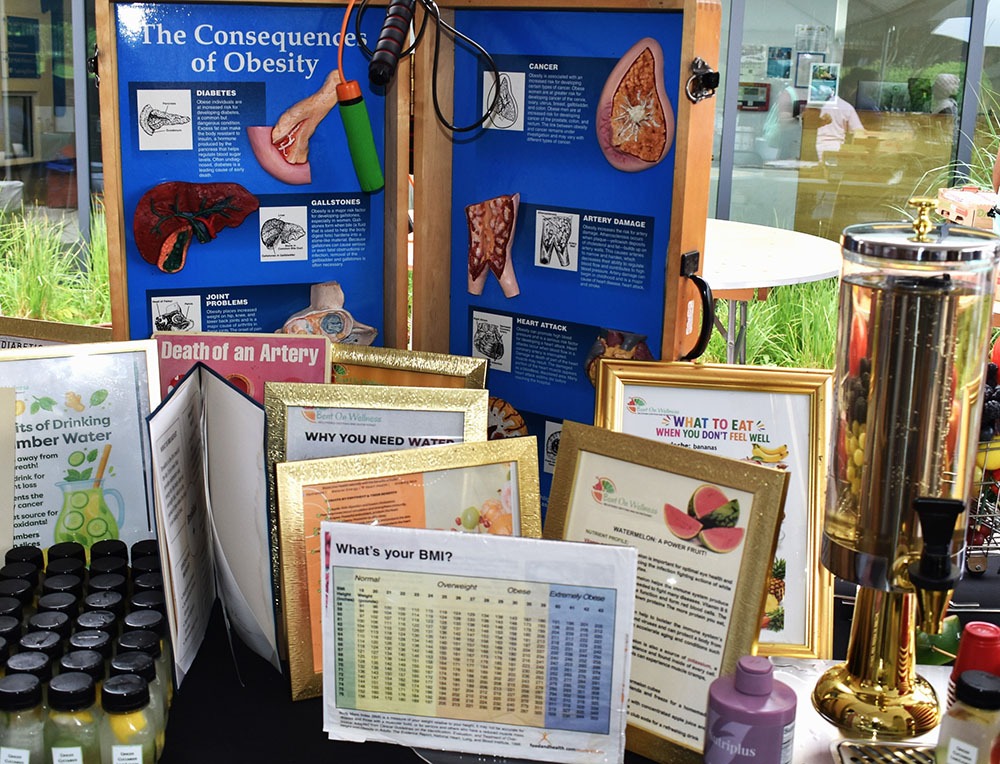
Photo by Miriam Quiñones
Kerr went on to say that she, herself, was proud to participate as a vendor on the day, saying, “It was an honor to take part in such a powerful community event. When we come together to share resources and encourage healthy living, we help build a stronger, healthier Bronx.”
She explained that the health fair was held in partnership with Lisa Dawson, current president of the North Bronx Section of the National Council of Negro Women, and the Williamsbridge National Association for the Advancement of Colored People (NAACP) which, in turn, has strong ties with another North Bronx-based group, the Bridgefield Civic League, Inc.
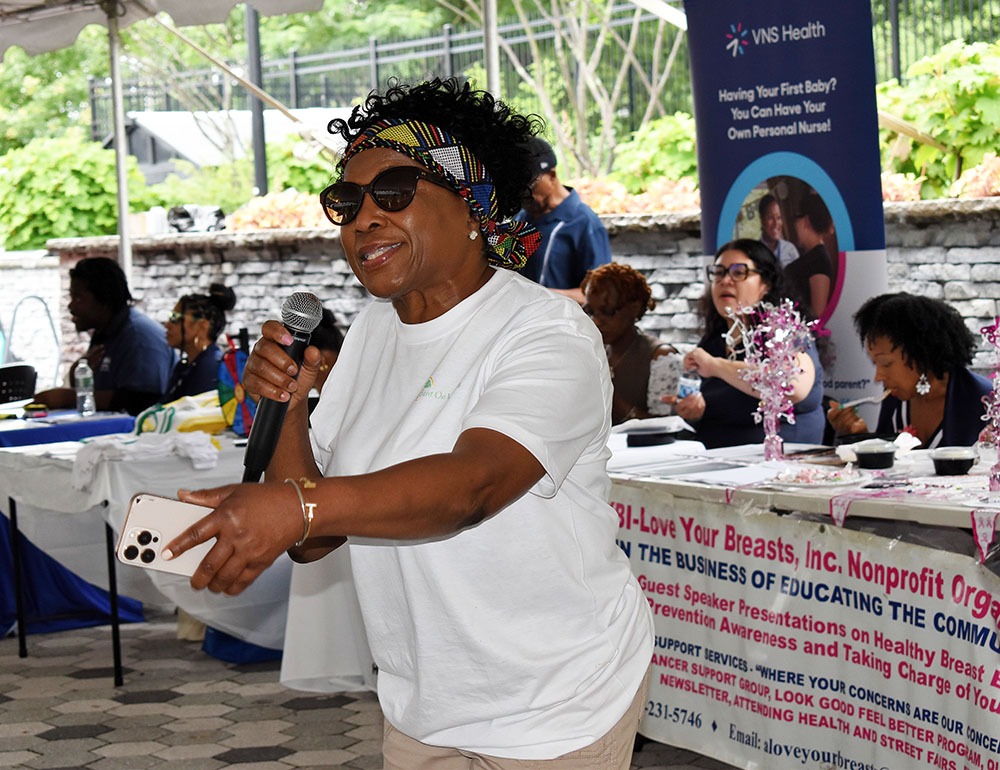
Photo by Miriam Quiñones
Founded by a group of African-American women in 1968 as a non-profit, tax-exempt, 501c(3) organization, Bridgefield Civic League, Inc. has supported the Northeast Bronx community through charitable events, educational programs, and cultural events, according to its website.
Its mission is dedicated to strengthening communities across The Bronx and New York City by promoting civic engagement, education, and social responsibility.

Photo by Miriam Quiñones
“This health fair reflects what can happen when community organizations work together with purpose and compassion,” said Dawson. “Our goal was to make sure residents had access to information, resources, and support that can make a real difference in their lives.”
Located at 1250 East 229th Street, the YMCA was transformed into an exhibition space as well as a tabling and dancing venue. The event focused primarily on three areas. The Health & Wellness strand related to promoting healthier lifestyles. Attendees were, for example, able to get their blood pressure and blood sugar levels checked on the day.
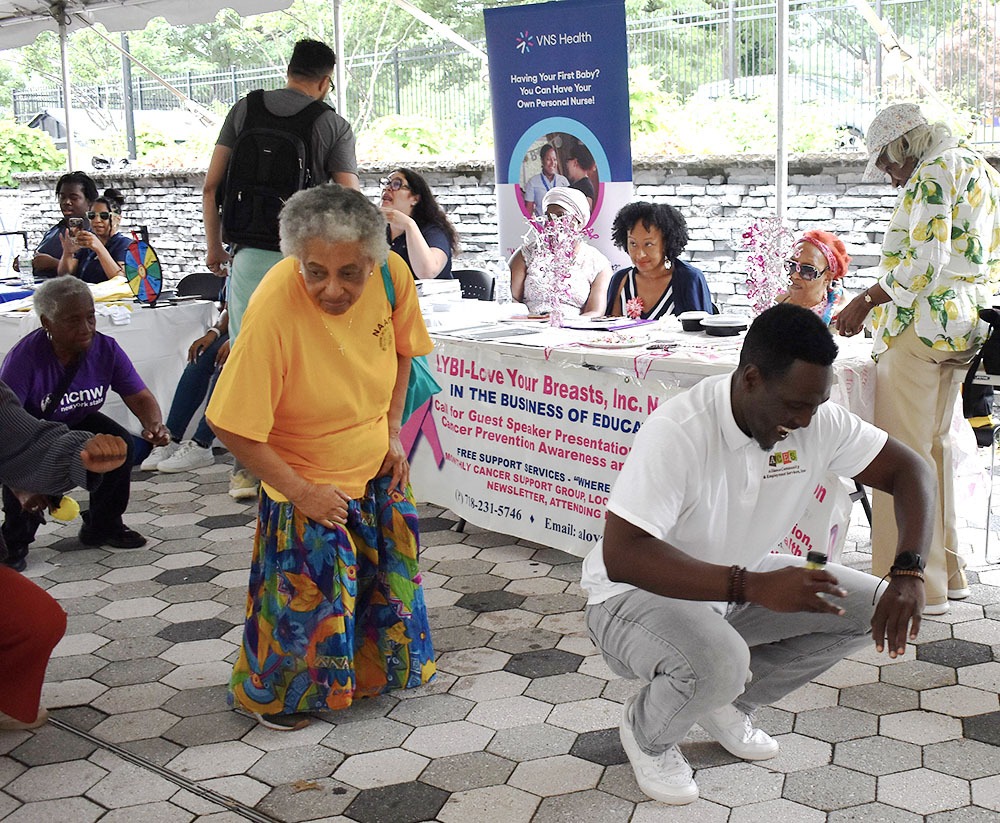
Photo by Miriam Quiñones
A second area focused on community support. Aleksander Nilaj from the American Albanian Open Hand Association supplied and distributed boxes of free fresh fruits and vegetables to the community, as organizers highlighted the importance of a healthy diet.
The third aspect was atmosphere. The event featured great music that got people dancing and interacting, while a healthy lunch was also provided.
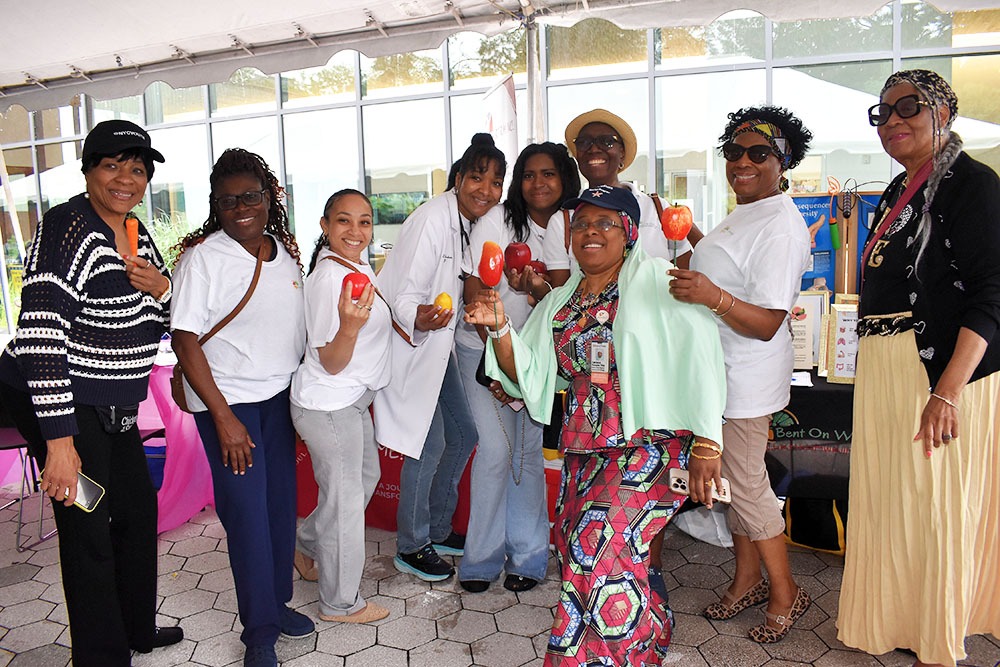
Photo by Miriam Quiñones
Sponsors and supporters included Montefiore Hospital, MetroPlusHealth, Love Your Breast, the New York City Fire Department (FDNY), and other community partners.
Organizers said the health fair was a joyful reminder that health is wealth and that strong partnerships, guided by committed leaders like Bent, can help create healthier, more informed, and more connected communities.
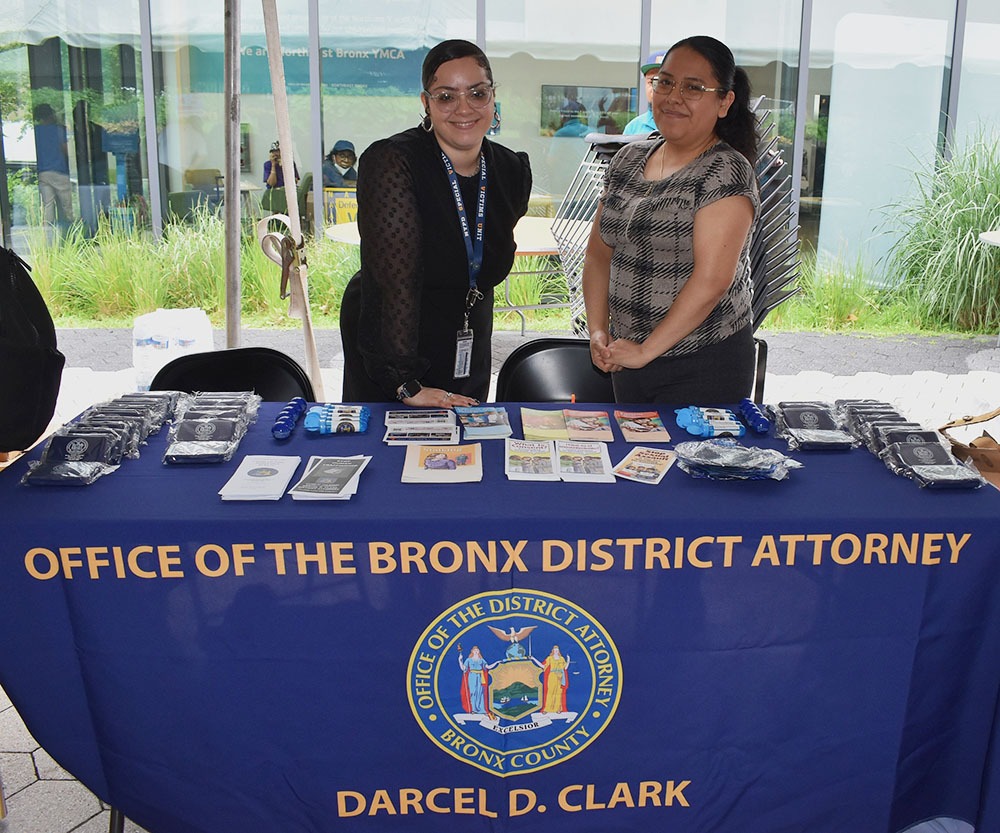
Photo by Miriam Quiñones
Elsewhere, there was face-painting for kids, and a host of organizations tabled and shared fliers and brochures listing various health and wellness resources.
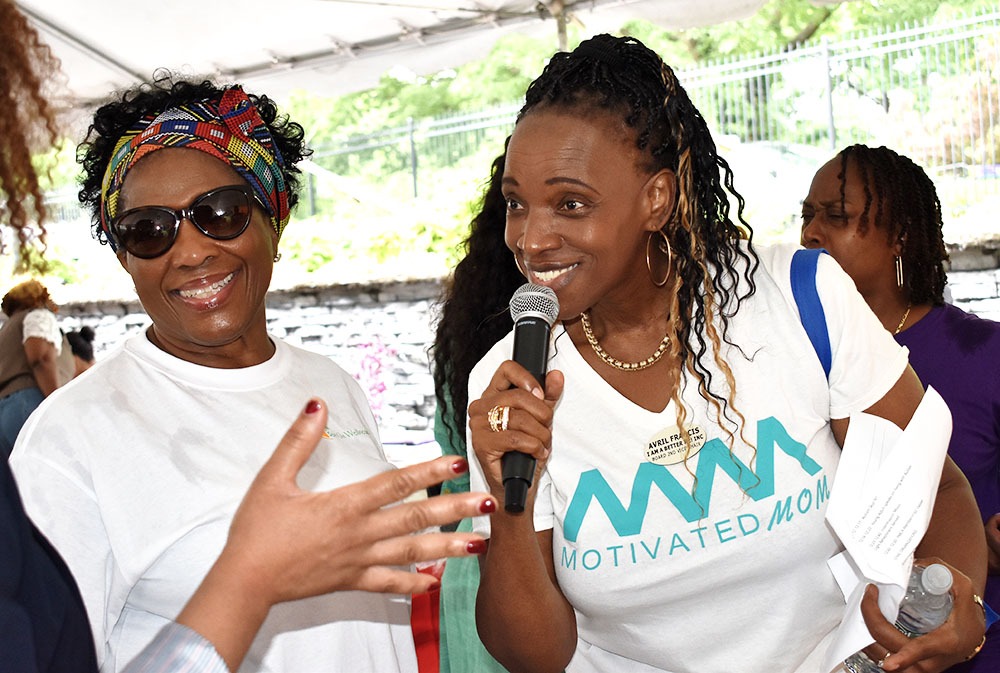
Among the attendees were Avril Francis, radio producer with the Avril Show, the Office of the Bronx District Attorney, NCNW North Bronx Section, a school located at 4035 White Plains Road and more.
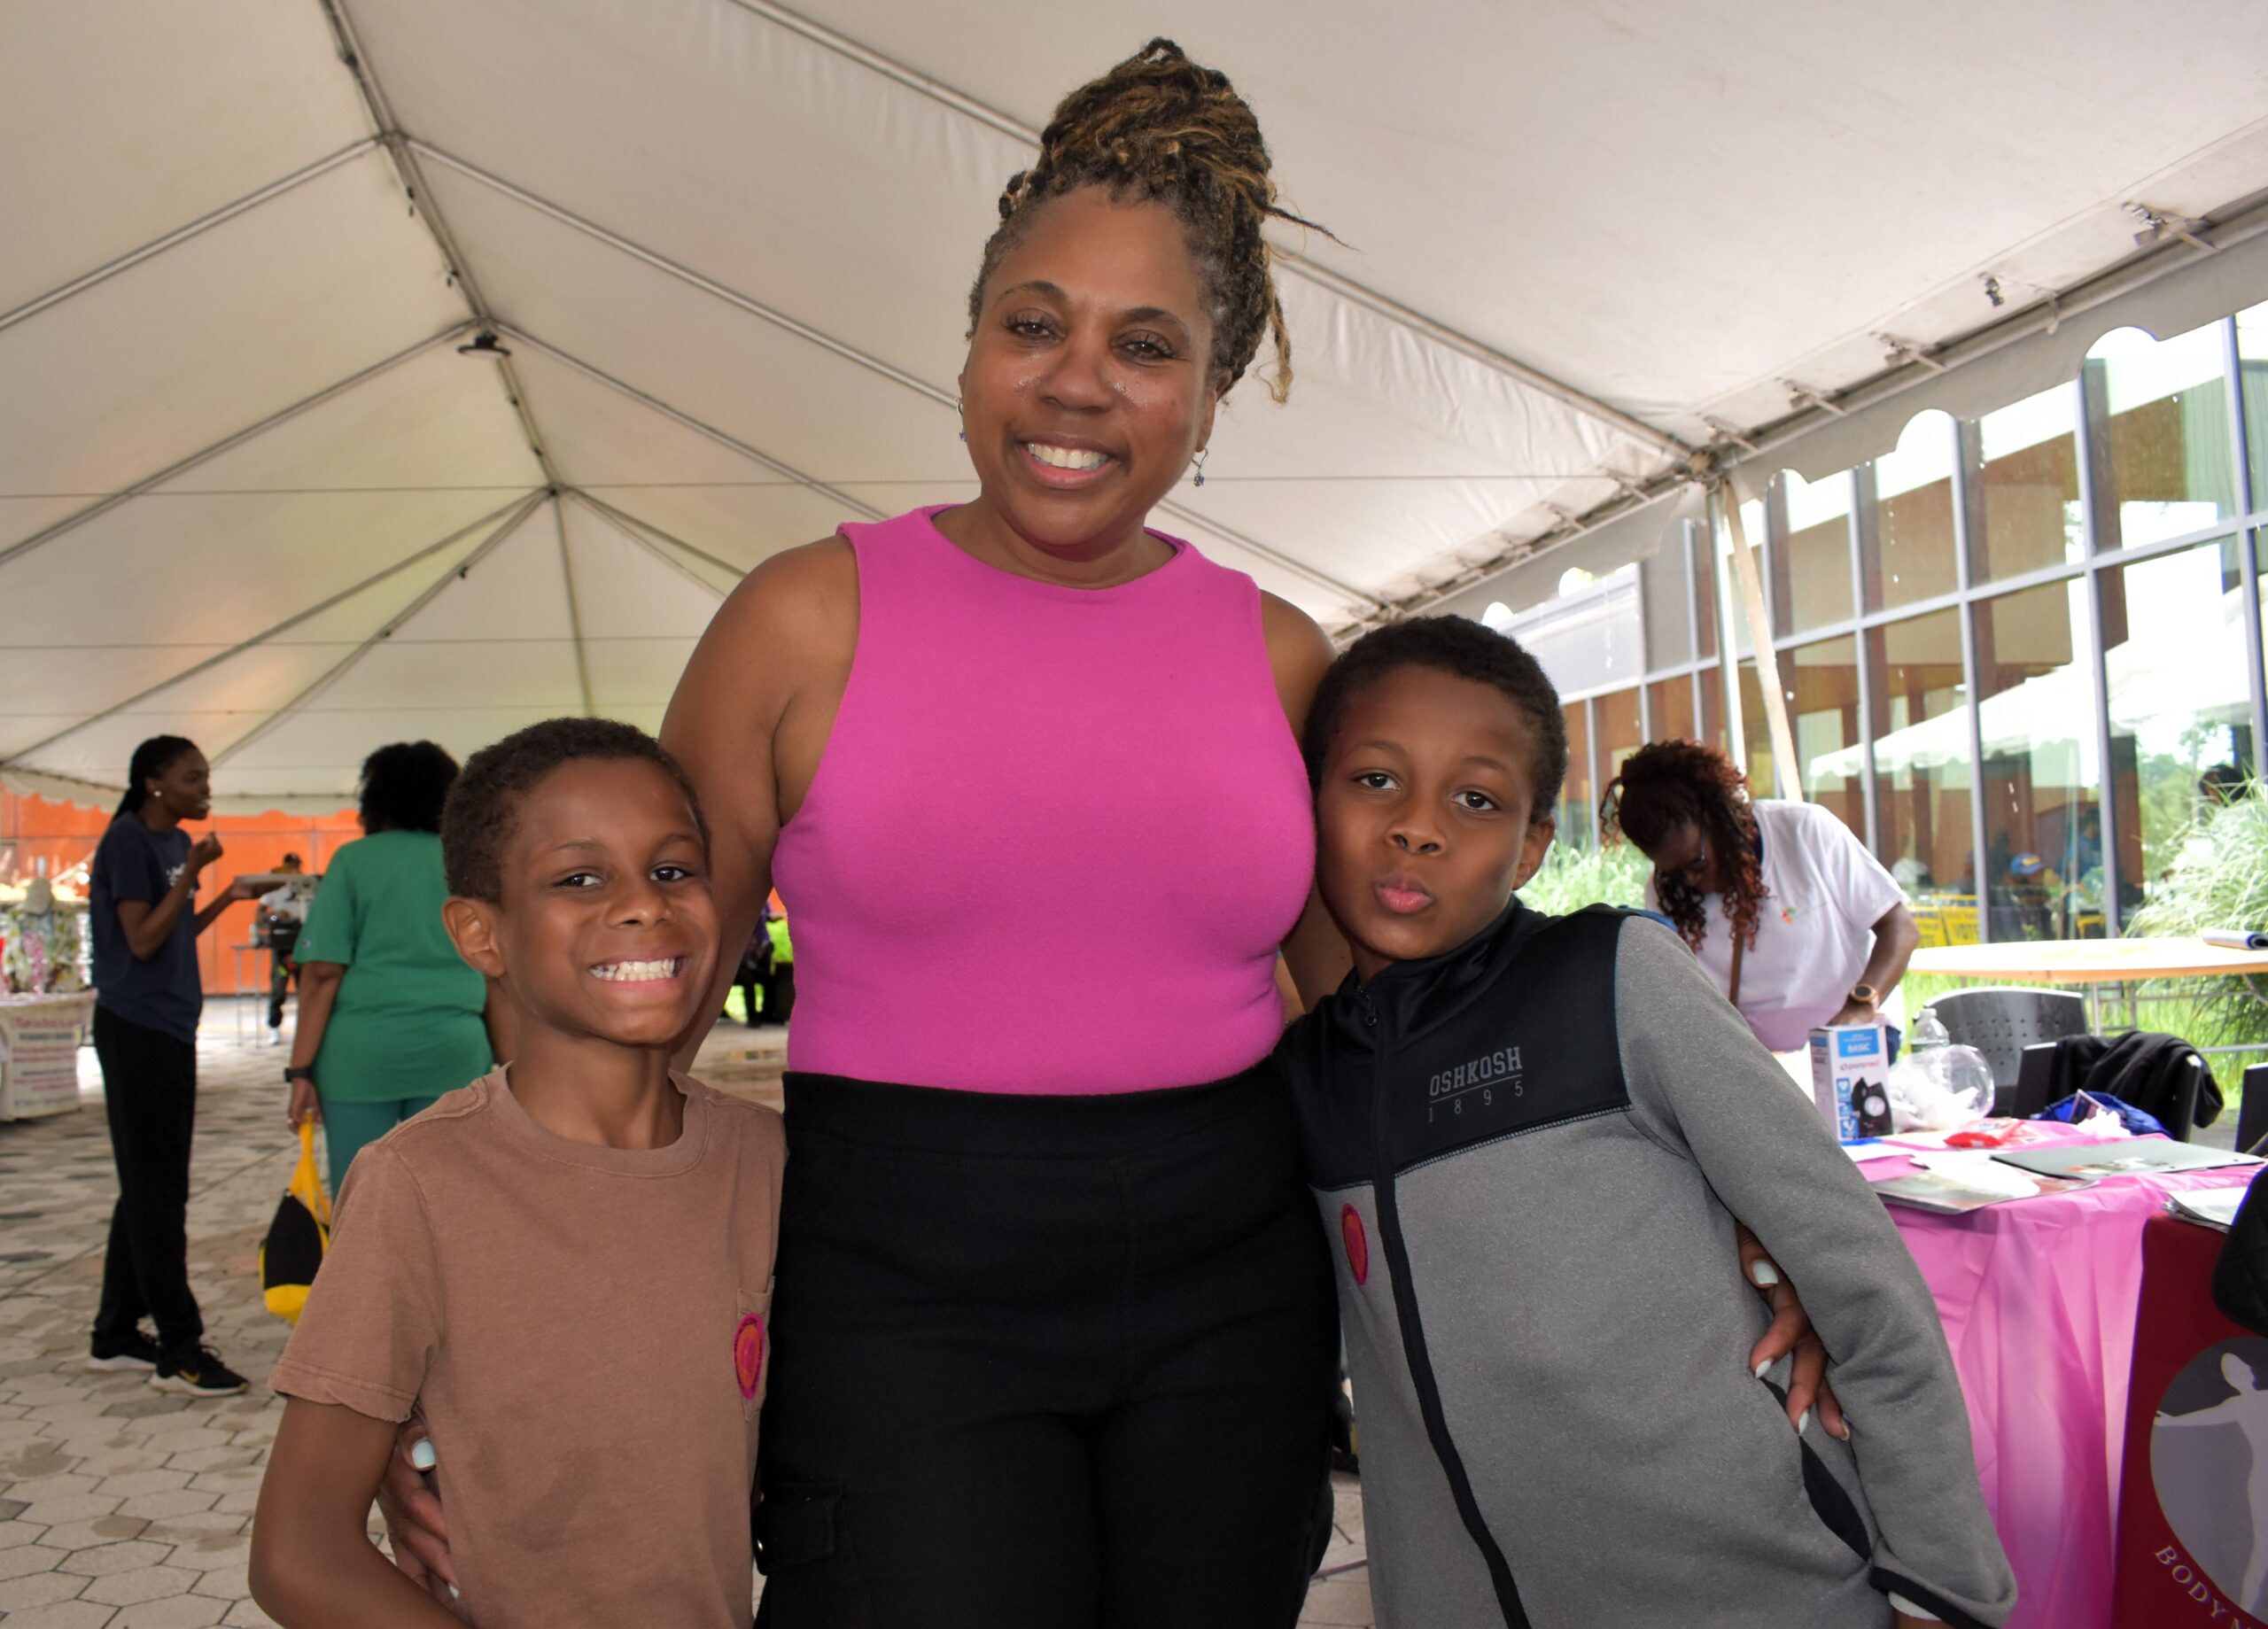
Photo by Miriam Quiñones
As reported, The Bronx continues to rank last out of New York’s 62 counties when it comes to good health.
This is despite various initiatives and events aimed at improving the ranking like the annual “Run the Bronx” and “Tour de Bronx.”
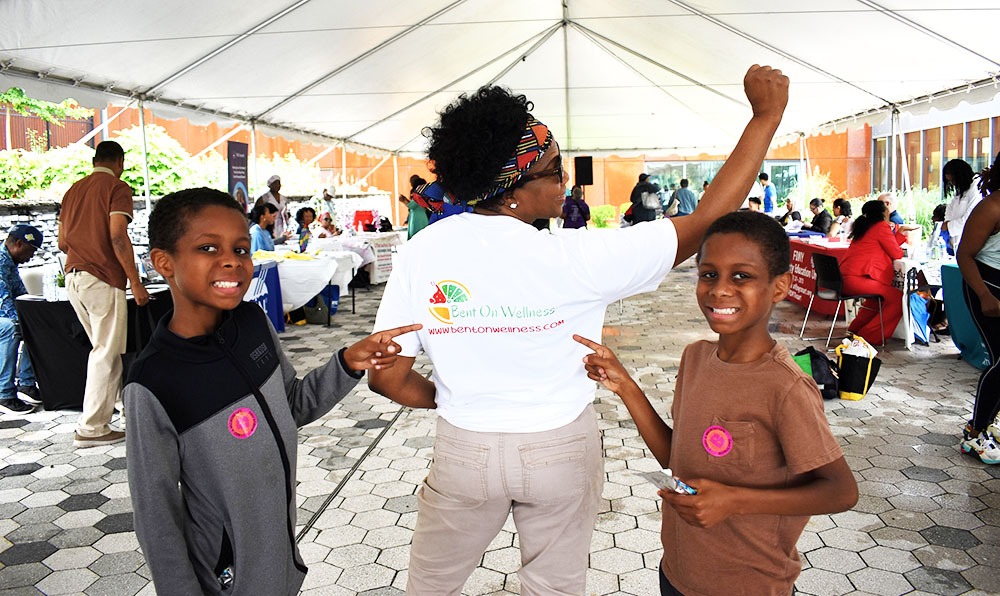
Photo by Miriam Quiñones
Some of the latest available Bronx County health indicators according to New York State Department of Health, broken down by race and ethnicity are outlined in the following graphs.
| Bronx County Health Indicators by Race and Ethnicity, 2021-2023 | ||||||
| Health Indicator | Non-Hispanic | Hispanic | Total | |||
| White | Black | Asian/Pacific | American Indian | |||
| Islander | or Alaska Native | |||||
| Socio-Demographic Indicators | ||||||
| Population (2024) | 122,886 | 410,192 | 64,648 | 4,201 | 767,477 | 1,384,724 |
| Percentage of population (2024) | 8.90% | 29.60% | 4.70% | 0.30% | 55.40% | 100.00% |
| Percentage of population aged 65 years or older (2023) | 28.20% | 15.70% | 15.40% | 15.10% | 12.90% | 15.20% |
| Median annual household income in US dollars (2020-2024)~ | 78,005 | 50,010 | 74,012 | 47,392 | 41,962 | 48,676 |
| Percentage of families below poverty (2020-2024)~ | 8.70% | 20.90% | 14.60% | 27.90% | 26.50% | 22.50% |
| Percentage of children under age 18 below poverty (2020-2024)~ | 20.00% | 34.60% | 23.80% | 37.00% | 39.50% | 35.90% |
| Percentage unemployed among the civilian labor force (2020-2024)~ | 8.00% | 12.00% | 6.20% | 8.60% | 12.00% | 11.40% |
| Percentage of population with no health insurance (2020-2024)~ | 3.40% | 6.20% | 5.00% | 12.70% | 8.30% | 7.10% |
| Percentage of population aged 25 years or older with a bachelor’s degree or higher (2020-2024)~ | 41.90% | 23.70% | 38.40% | 15.80% | 16.10% | 22.40% |
| Percentage of population in single parent families (2020-2024)~ | 9.20% | 36.10% | 9.00% | 36.60% | 36.10% | 32.00% |
| Percentage of population with a disability (2020-2024)~ | 19.20% | 17.10% | 12.20% | 16.60% | 18.30% | 17.70% |
| Percentage of population who speak English less than very well (2020-2024)~ | 10.80% | 9.80% | 42.30% | 33.10% | 37.70% | 14.70% |
| Percentage of high school students who dropped out (2023-2024) | 5.00% | 9.70% | 2.80% | 10.50% | 11.90% | 10.30% |
| Arrests per 1,000 population aged 18 years or older (2022-2024) | 13.4 | 62.2 | 12.8 | 25.5 | 35.9 | 40.6 |
Source: New York State Department of Health
Bronx County Health Indicators by Race and Ethnicity, 2021-2023
| Health Indicator | Non-Hispanic | Hispanic | Total | |||
| White | Black | Asian/Pacific | American Indian | |||
| Islander | or Alaska Native | |||||
| General Health Indicators | ||||||
| Total mortality per 100,000 population, age-adjusted | 717.6 | 773.6 | 259.9 | 69.2* | 644.5 | 714.5 |
| Percentage of deaths that are premature (< 75 years) | 36.90% | 64.80% | 46.80% | 75.0%* | 58.10% | 56.70% |
| Years of potential life lost per 100,000 population, age-adjusted | 7,883.80 | 10,559.60 | 1,872.60 | 2,232.80 | 7,411.90 | 8,610.70 |
| Potentially preventable hospitalizations among adults, age-adjusted rate per 10,000 (2022-2024) | 79.6 | 163.8 | 52.8 | 69.4 | 155.7 | 175.8 |
Source: New York State Department of Health
Bronx County Health Indicators by Race and Ethnicity, 2021-2023
| Health Indicator | Non-Hispanic | Hispanic | Total | |||
| White | Black | Asian/Pacific | American Indian | |||
| Islander | or Alaska Native | |||||
| Birth-Related Indicators | ||||||
| Number of births per year (3 year average) | 932 | 4,277 | 875 | 7 | 9,658 | 16,536 |
| Percentage of births with early (1st trimester) prenatal care | 70.30% | 54.50% | 64.00% | s | 58.90% | 58.20% |
| Percentage of births with adequate prenatal care (APNCU)^ | 69.90% | 59.30% | 70.90% | s | 63.00% | 62.40% |
| Percentage of premature births (< 37 weeks gestation – clinical estimate) | 9.10% | 13.90% | 10.40% | s | 10.40% | 11.20% |
| Percentage of low birthweight births (< 2.5 kg) | 8.80% | 14.50% | 13.30% | s | 9.10% | 10.80% |
| Teen pregnancies per 1,000 females aged under 18 years | 1.5 | 5.8 | 1.7 | NA | 6.2 | 6.3 |
| Pregnancies per 1,000 females aged 15-44 years | 61.7 | 91.8 | 78.9 | NA | 89.7 | 96.3 |
| Fertility per 1,000 females aged 15-44 years | 45.8 | 49.1 | 65.2 | 7.3 | 56.8 | 56.1 |
| Infant mortality per 1,000 live births | 5 | 7.5 | 1.5* | s | 2.9 | 5.1 |
| Percentage of low-risk births delivered by cesarean section | 31.10% | 34.50% | 32.10% | s | 30.00% | 31.40%
|
Source: New York State Department of Health
Bronx County Health Indicators by Race and Ethnicity, 2021-2023
| Health Indicator | Non-Hispanic | Hispanic | Total | |||
| White | Black | Asian/Pacific | American Indian | |||
| Islander | or Alaska Native | |||||
| Injury-Related Indicators | ||||||
| Motor vehicle-related mortality per 100,000 population, age-adjusted | 5.5 | 4.7 | 2.5* | 0.0* | 5.2 | 5.2 |
| Unintentional injury mortality per 100,000 population, age-adjusted | 86.9 | 78.9 | 8 | 6.9* | 73.8 | 76 |
| Unintentional injury hospitalizations per 10,000 population, age-adjusted (2022-2024) | 71 | 66.7 | 31.8 | 24.2 | 75.9 | 100.3 |
| Fall hospitalizations per 10,000 population, aged 65 years or older (2022-2024) | 212.6 | 119.9 | 98.3 | 65.8 | 157.8 | 211.6 |
| Poisoning hospitalizations per 10,000 population, age-adjusted (2022-2024) | 13.5 | 15.2 | 2.5 | s | 13.8 | 18.1 |
| Suicide mortality per 100,000 population, age-adjusted | 9.7 | 5.5 | 2.9* | 0.0* | 5.5 | 5.9 |
| Overdose deaths involving opioids, and non-fatal opioid related hospital events per 100,000 population | 792.2 | 507.6 | 23.4 | 266.9 | 394 | 508 |
Source: New York State Department of Health
Bronx County Health Indicators by Race and Ethnicity, 2021-2023
| Health Indicator | Non-Hispanic | Hispanic | Total | |||
| White | Black | Asian/Pacific | American Indian | |||
| Islander | or Alaska Native | |||||
| Respiratory Disease Indicators | ||||||
| Asthma hospitalizations per 10,000 population, age-adjusted (2022-2024) | 5.6 | 22.5 | 8.5 | 13.1 | 25.2 | 27.8 |
| Asthma hospitalizations per 10,000 population, aged 0-17 years (2022-2024) | 9.1 | 42.8 | 18.6 | 30.7* | 43.7 | 54 |
| Chronic lower respiratory disease mortality per 100,000 population, age-adjusted | 24.2 | 17.6 | 6 | 0.0* | 16.6 | 18.7 |
| Chronic lower respiratory disease hospitalizations per 10,000 population, age-adjusted (2022-2024) | 16.3 | 36 | 12.1 | 19.7 | 36.5 | 42.1 |
| Percentage of fee-for-service (FFS) Medicare enrollees who had an annual flu vaccination (2023)~~ | 47% | 32% | 43% | 35% | 31% | 37% |
Source: New York State Department of Health
Bronx County Health Indicators by Race and Ethnicity, 2021-2023
| Health Indicator | Non-Hispanic | Hispanic | Total | |||
| White | Black | Asian/Pacific | American Indian | |||
| Islander | or Alaska Native | |||||
| Heart Disease and Stroke Indicators | ||||||
| Diseases of the heart mortality per 100,000 population, age-adjusted | 191.3 | 209.6 | 62.7 | 6.9* | 142.9 | 178.7 |
| Diseases of the heart hospitalizations per 10,000 population, age-adjusted (2022-2024) | 56.5 | 89.3 | 45 | 43.3 | 82.1 | 98.2 |
| Cerebrovascular disease (stroke) mortality per 100,000 population, age-adjusted | 22.1 | 30.3 | 12.2 | 8.7* | 26.9 | 27.9 |
| Cerebrovascular disease (stroke) hospitalizations per 10,000 population, age-adjusted (2022-2024) | 14.1 | 29.4 | 11.7 | 7.4 | 22.1 | 29.6 |
| Coronary heart disease mortality per 100,000 population, age-adjusted | 164 | 175.5 | 53.4 | 6.9* | 118.3 | 149.7 |
| Coronary heart disease hospitalizations per 10,000 population, age-adjusted (2022-2024) | 14.8 | 16.5 | 20.4 | 13.2 | 21.3 | 24.2 |
| Congestive heart failure mortality per 100,000 population, age-adjusted | 8 | 8.7 | 1.9* | 0.0* | 7.4 | 8.2 |
| Potentially preventable heart failure hospitalization rate per 10,000 population aged 18 years or older (2022-2024) | 40.6 | 61.7 | 17.6 | 22.8 | 44.7 | 58.9 |
Source: New York State Department of Health
Bronx County Health Indicators by Race and Ethnicity, 2021-2023
| Health Indicator | Non-Hispanic | Hispanic | Total | |||
| White | Black | Asian/Pacific | American Indian | |||
| Islander | or Alaska Native | |||||
| Diabetes Indicators | ||||||
| Diabetes mortality per 100,000 population, age-adjusted | 15.7 | 24.6 | 8.9 | 0.0* | 21.8 | 22.2 |
| Diabetes (primary diagnosis) hospitalizations per 10,000 population, age-adjusted (2022-2024) | 14.8 | 35.3 | 8.8 | 12.7 | 33.5 | 37.1 |
| Diabetes (any diagnosis) hospitalizations per 10,000 population, age-adjusted (2022-2024) | 170.9 | 336.7 | 186 | 187.9 | 349.2 | 382.3 |
| Potentially preventable diabetes short-term complications hospitalization rate per 10,000 population aged 18 years or older (2022-2024) | 3.9 | 11.9 | 1.5 | 0.0* | 9.8 | 11.9 |
Source: New York State Department of Health
Bronx County Health Indicators by Race and Ethnicity, 2021-2023
| Health Indicator | Non-Hispanic | Hispanic | Total | |||
| White | Black | Asian/Pacific | American Indian | |||
| Islander | or Alaska Native | |||||
| Cancer Indicators | ||||||
| Lung cancer incidence per 100,000 population, age-adjusted (2020-2022) | 53.6 | 43.8 | 34.4 | NA | 30.6 | 38.5 |
| Colorectal cancer mortality per 100,000 population, age-adjusted (2020-2022) | 16.5 | 10.7 | s | NA | 8.3 | 10.3 |
| Colorectal cancer incidence per 100,000 population, age-adjusted (2020-2022) | 42.3 | 36 | 22.1 | NA | 30.4 | 33.8 |
| Female breast cancer mortality per 100,000 female population, age-adjusted (2020-2022) | 16.7 | 20.2 | s | NA | 12.2 | 16 |
| Female late stage breast cancer incidence per 100,000 female population, age-adjusted (2020-2022) | 45.9 | 51.1 | 33.9 | NA | 36.2 | 42.4 |
| Cervix uteri cancer mortality per 100,000 female population, age-adjusted (2020-2022) | s | 3.5 | s | NA | 2 | 2.4 |
| Cervical cancer incidence per 100,000 female population, age-adjusted (2020-2022) | 8.4 | 7.8 | s | NA | 10.3 | 9 |
| Percentage of female fee-for-service (FFS) Medicare enrollees aged 65-74 years who received an annual mammography screening (2023)~~ | 30% | 29% | 22% | 0% | 24% | 28% |
Source: New York State Department of Health
Bronx County Health Indicators by Race and Ethnicity, 2021-2023 Symbol Meanings
| Symbol | Meaning |
| * | The rate or percentage is unstable. See the “Technical Notes” page |
| s | Data are suppressed. The data do not meet the criteria for confidentiality. |
| ~ | White non-Hispanic, Black (including Hispanic), Asian (including Hispanic, excluding Pacific Islanders), American Indian or Alaska Native (including Hispanic), and Hispanic (of any race). |
| ~~ | White non-Hispanic, Black (including Hispanic), Asian / Pacific Islander (including Hispanic), and Hispanic (of any race). |
| NA | Data do not meet the criteria for statistical reliability or data quality, or data not available. |
| ^ | APNCU: Adequacy of Prenatal Care Utilization Index. |
| In 2015, SPARCS transitioned from ICD-9-CM to ICD-10-CM diagnosis codes. These two are not comparable, so ED and hospitalization data for 2016-and-forward should not be compared with earlier data. | |
| The 2018 population estimates are also used to calculate rates for 2019 and 2020. Later years are from the most recent Vintage estimates. |
Source: New York State Department of Health
Attendees were encouraged to keep the summer momentum going by continuing to eat healthily.
*Síle Moloney contributed to this story.

admin
Welcome to the Norwood News, a bi-weekly community newspaper that primarily serves the northwest Bronx communities of Norwood, Bedford Park, Fordham and University Heights. Through our Breaking Bronx blog, we focus on news and information for those neighborhoods, but aim to cover as much Bronx-related news as possible. Founded in 1988 by Mosholu Preservation Corporation, a not-for-profit affiliate of Montefiore Medical Center, the Norwood News began as a monthly and grew to a bi-weekly in 1994. In September 2003 the paper expanded to cover University Heights and now covers all the neighborhoods of Community District 7. The Norwood News exists to foster communication among citizens and organizations and to be a tool for neighborhood development efforts. The Norwood News runs the Bronx Youth Journalism Heard, a journalism training program for Bronx high school students. As you navigate this website, please let us know if you discover any glitches or if you have any suggestions. We’d love to hear from you. You can send e-mails to norwoodnews@norwoodnews.org or call us anytime (718) 324-4998.